 Arena Training
 Do you need to analyze profit and loss? Or track changes over time? A waterfall chart may be the tool of choice. You can visually represent cash flow, budget changes, outliers and anomalies using this technique. These charts are a terrific way to visually present data in an appealing and intuitive manner.
Objectives:
- Description of Waterfall Charts
- Uses of Waterfall Charts
- Creating a Waterfall Chart in Excel
What is a Waterfall Chart?
A waterfall chart is a type of data visualization that provides a visual representation of how an initial value increases or decreases over time or across different categories. It is commonly used to illustrate financial data, such as analyzing profit and loss statements or tracking budget changes.
Uses of Waterfall Charts
- Analyzing financial data: Waterfall charts are commonly used in finance and accounting to analyze profit and loss statements, cash flow statements, or budget changes. They provide a clear picture of how different factors contribute to the overall change in financial figures, such as revenue, expenses, or net income.
- Highlighting positive and negative contributions: The waterfall chart’s design helps distinguish between positive and negative values easily. It shows the cumulative effect of each category or stage, making it simpler to identify which factors are increasing or decreasing the overall value.
- Tracking changes over time: If you want to visualize how a particular value changes over time, a waterfall chart can help. By representing each period or interval as a step in the chart, it becomes apparent how the value evolves and how different factors contribute to the overall change.
- Communicating data insights: Waterfall charts are effective for presenting data in a visually appealing and intuitive manner. They can simplify complex information and help stakeholders understand the key drivers behind changes in a dataset. Whether you are presenting to colleagues, clients, or executives, a waterfall chart can convey insights in a concise and visually engaging way.
- Comparing scenarios or alternatives: Waterfall charts can be used to compare different scenarios or alternatives side by side. By creating multiple waterfall charts, you can showcase the differences in the contribution of various factors across scenarios, enabling easy comparisons and decision-making.
- Identifying outliers or anomalies: With a waterfall chart, it is easier to identify outliers or significant deviations from the norm. Sudden jumps or drops in the chart can indicate areas that require further investigation or highlight unexpected trends that merit attention.
Create the Waterfall Chart
¡IMPORTANT!
Waterfall charts cannot be created from a Pivot Table.
Instructions:
- Prepare your data: Organize your data in a table with two columns. The first column should contain the categories or stages, and the second column should contain the corresponding values.
- Insert the chart: Select the data range, including both columns, and go to the “Insert” tab in Excel’s ribbon. Choose the “Waterfall” chart type from the available chart options. It is usually located in the “Charts” or “Column” section.
- Customize the chart: Once the chart is inserted, you can customize it to suit your needs. Right-click on any element of the chart and choose “Format Chart Area” to modify the overall appearance, such as adjusting the chart title or background color.
- Format the data series: Right-click on any column in the chart and select “Format Data Series” or “Format Data Point” to access the formatting options specific to the waterfall chart. Here, you can change the color, add data labels, adjust the gap width, or customize the connector lines.
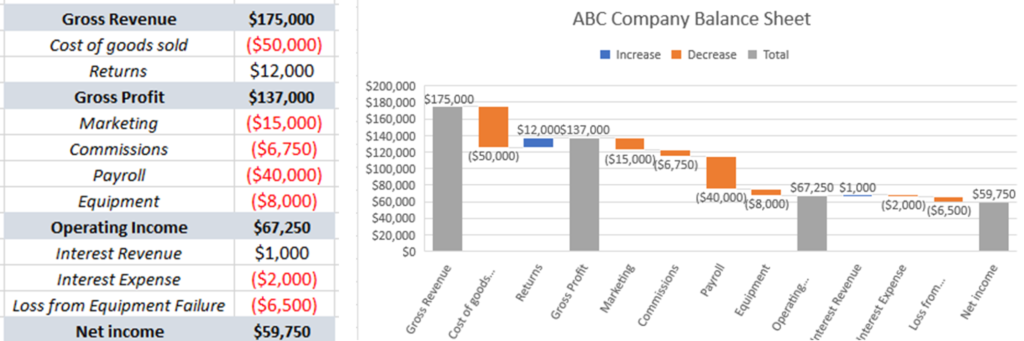
- You may have to mark subtotals or totals of certain data points for your chart to make sense. In any Waterfall chart, you might set a subtotal to show the absolute value rather than as a floating value relative to the previous column. In the Gross Profit Example, the data points, the line item accounts—Gross Revenue, Gross Profit, Operating Income and Net Income—are all totals that behave like checkpoints in understanding our financial statement. Right-Click on these data points individually and set as total so they are not “floating.”
- Include additional features: You can further enhance the waterfall chart by adding additional data labels, such as total values or intermediate calculations. Right-click on the chart and choose “Add Data Labels” or “Add Data Callouts” to display these values.
- Fine-tune the axes and gridlines: Adjust the chart’s axes and gridlines by right-clicking on them and selecting the “Format Axis” or “Format Major Gridlines” option. Here, you can modify the scale, number formats, or appearance of the axes and gridlines.
- Save and share the chart: Once you are satisfied with the chart’s appearance, save your Excel workbook. You can then share the file or copy and paste the chart into other applications or documents as needed.
By following these steps, you can create a waterfall chart in Excel to visualize the flow of values and the impact of various factors on a starting value. This chart type is particularly useful for analyzing financial statements, profit and loss statements, and other scenarios where you want to understand how different factors contribute to a final outcome.
Overall, waterfall charts offer a clear and comprehensive representation of data, enabling better analysis, understanding, and communication of complex information.
PUT (Power User Tip)
Use “subtotals” to create checkpoints and split up certain types of gains/losses.